Impact of Partial Lead Service Line Replacements on Water Lead Levels in New Orleans, LA
July 21, 2017
Due to an increase in questions about the potential impact of partial lead service line replacements (PLSLRs) on water lead levels (WLLs), I am presenting a summary of our results from 5 homes with recent PLSLSRs. Instructions for how to appropriately flush homes after PLSLRs is provided here.
Water Lead Levels in New Orleans at Sites with Lead Service Line Replacements
Hurricane damage to water infrastructure necessitated a multi-year project to repair and replace corroding water mains, lead service lines (LSLs), sewer lines, drainage pipes, gas lines and other underground utilities by neighborhood throughout the city. While over ten years have passed since Hurricane Katrina, the rebuilding process is still ongoing, and the city of New Orleans (NOLA) is still in the process of conducting 16,000 PLSLRs (Black and Veatch 2016). These conditions were evident during this sampling effort, as 43% of survey respondents reported there was street or side walk work on their block within the last year (n=287). For homes undergoing PLSLRs, the City of New Orleans recommends on their Roadwork website, that residents “Run cold water at a high flow at all of your faucets for at least 5 minutes each, one at a time, starting with the faucet closest to your water meter”; clean faucets aerators; and continue to flush for at least a month before using the water (S&WB 2017). However, since NOLA meets the U.S. Environmental Protection Agency’s (US EPA) Lead and Copper Rule (LCR) lead Action Level (AL) requirements, no public education about the need for more rigorous flushing is required. Given the fact that public education is not required, and that rigorous flushing may not be effective for exposure prevention purposes unless conduced in a rigorous and repeated fashion, low-use sites or sites with PLSLRs may pose a greater risk of exposure to high WLLs. This is a particularly important concern considering the extent to which these conditions are common throughout NOLA today.
Five of our study participants contacted the S&WB to request removal of their LSL. All but one of these residents received a partial LSL replacement (PLSLR) (only the utility side was replaced) – one had the full line replaced. All of the sites were resampled after the PLSLR and the utility’s reported 15 minute post-PLSLR flush, but the collection procedure for the samples varied from home to home. Table 1 shows sampling procedures and WLL results for each site.
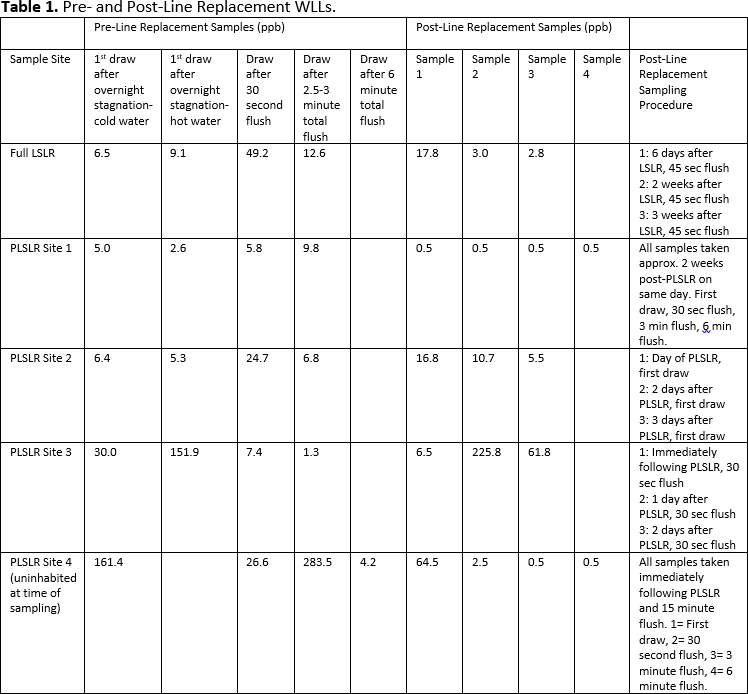
As shown in Table 1, prior to the line replacement, four of these five sites had at least one sample with WLLs above the 15 ppb lead AL. Residents were encouraged to purchase water filters if continued use of the water for drinking or cooking was expected.
Even 6 days after a full line replacement, WLLs still exceeded the regulatory requirements for lead in water (15 ppb). WLLs as high as 226 ppb were seen one day after a PLSLR after a 30 second flush. No definitive conclusions can be drawn from the post-LSLR samples due to the small sample size and variance in the sampling procedure. However, the persistent elevation in WLLs days after the line replacement in the full LSLR site and PLSLR Sites 2 and 3 indicates that care should be taken to flush systems rigorously and regularly after line replacements. More research is being conducted to evaluate how frequently flushing would need to be conducted to maintain low WLLs after a PLSLR. One study simulated PLSLRs in NOLA, and observed that intermittent flushing over a two week period was not long enough to stabilize WLLs (Boyd et al. 2004). In keeping, previous studies suggest several weeks, months, or maybe years (Desmarais et al. 2015; Camara et al. 2011, 2015) may be required to remediate increased WLL exposure after PLSLRs.
References:
Black and Veatch. 2016. Report on operations for 2015: Black and Veatch Project No. 192043. Prepared for the Sewerage and Water Board. Available: https://www.swbno.org/docs.asp. Accessed: 6/7/2017.
Boyd G, Shetty P, Sandvig AM, Pierson GL. 2004. Pb in Tap Water Following Simulated Partial Lead Pipe Replacements. Journal of Environmental Engineering. Vol. 130. Number 10. pp. 1188 – 1197.
Camara, E., Montreuil, K.R., Knowles, A.K. and Gagnon, G.A. 2013. Role of the water main in lead service line replacement:a utility case study. J. Am. Water Works Assoc., 105(8): E423–E431.
Commons C. 2011. Effect of a partial lead service line replacement on total lead at the tap. Rhode Island Department of Health, April 2011. RI, USA.
Commons C. 2015. A four-year follow-up on total lead at the tap following partial service line replacement in Cranston, RI. J AWWA 126(2):128.
Desmarais MC, Trueman B, Wilson P, Huggins D, Swertfeger J, Deshommes E, Prevost M. 2015. Impact of partial lead service line replacements on water quality: Lead profiling sampling results in 6 North American utilities. AWWA-WQTC Conference: 24.
Sewerage and Water Board of New Orleans (S&WB). 2017. Water Quality 2016 Report. Available: https://www.swbno.org/docs.asp. Accessed 5/2/2017.
Summary Data (as of 1/9/2017)
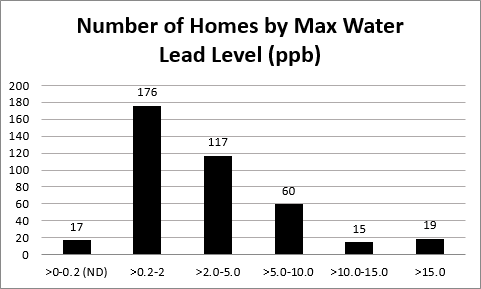
New Orleans water lead levels ranged from non-detect to 283.5 ppb (n=404 buildings, 1604 samples). Researchers tried to collect four samples per home (first draw, water after a 30 second flush, water after a 2 minute flush, water after a 5 minute flush or first-draw hot water). The figure below presents the number of homes by the maximum water lead levels.
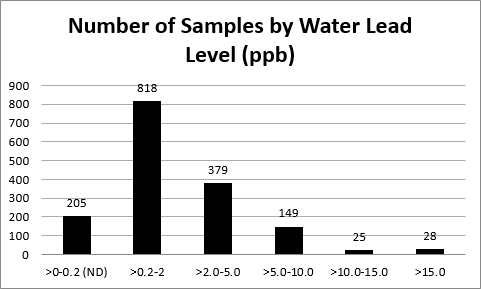
The figure below presents the number of samples by water lead level.
The figure below presents the percent of buildings sampled with maximum lead levels that exceeded certain water lead level standards.
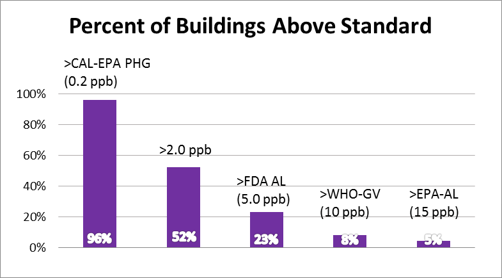
- EPA’s Maximum Contaminant Level Goal (MCLG) (0 ppb and California Environmental Protection Agency’s Threshold Level (CAL-EPA PHG, 0.2 ppb)- EPA’s health based goal for lead in drinking water established in 1991. 96% of buildings had some detectable lead (detection limit is 0.2 ppb). California’s health based standard that was lowered in 2009 from 2 ppb to 0.2 ppb based on neurodevelopmental effects in fetuses and infants. An estimated 96% of buildings had maximum water lead levels that exceeded this standard (0.2 ppb was the detection limit).
- U.S. Food and Drug Administration’s Allowable Level (FDA AL, 5 ppb)- FDA’s allowable lead level for bottled water set in 1994. Water lead levels > 5ppb have been associated with a one-point rise in children’s blood lead levels. An estimated 23% of buildings had maximum water lead levels that exceeded this standard.
- World Health Organization’s Guidance Value (WHO GV, 10 ppb)- WHO’s provisional standard for lead in drinking water set in 2011, and partly based on treatment performance and analytical achievability. An estimated 8% of buildings had maximum water lead levels that exceeded this standard.
- EPA’s Action Level (EPA AL, 15 ppb) – EPA’s regulatory standard established in 1991, used for evaluating water utility compliance with EPA’s requirements for lead in drinking water. It is not a health-based standard. An estimated 5% of buildings had maximum water lead levels that exceeded this standard.
Key Summary Points
- Lead is common in New Orleans water delivery lines and in indoor plumbing of old homes
- Lead can be introduced into water via lead connections and solder; brass faucet fixtures; galvanized steel pipes; and most significantly, by lead water service lines which can run from the street to the home.
- Based on historical survey data, an estimated 65-80% of New Orleans’ water service lines are lead- most were put down as early as the 1830s. This may be an overestimate now due to efforts by the S&WB to replace water lines throughout the city.
- New Orleans does not appear to have a lead in water problem as bad as Flint, Michigan’s
- Approximately 40% of the first draw samples for Flint, MI were over 5 parts per billion (ppb or micrograms of lead per liter of water (µg/L)).
- Based on our sampling of 404 buildings (n=1604 total samples), 23% of sites had a maximum water lead level over 5 ppb- not as bad as Flint, but still of concern.
- New Orleans’ water meets the US Environmental Protection Agency’s (EPA) regulatory requirements.
- EPA requires that no more than 10% of homes sampled exceed the lead Action Level (AL) of 15 ppb.
- According to the New Orleans Sewerage and Water Board data, New Orleans meets regulatory requirements.
- According to our data, which was not collected according to LCR standards, only 5% of homes we sampled exceeded 15 ppb of lead in water. It’s important to understand that we were unable to target high risk homes as required by the Lead and Copper Rule (LCR), thus even this amount is of concern.
- It is the researcher’s opinion that meeting regulatory requirements is not indicative of water that is safe to women of child-bearing age, pregnant women or infants. There are several reasons for this:
- The US Centers for Disease Control and Prevention (CDC) has determined that no amount of lead exposure is safe.
- Even if a home water test doesn’t show any lead contamination, it may not mean the water is consistently safe if it is passing through lead pipes.
- The EPA’s regulatory standard for lead in water (AL) is not a health-based standard.
- It was established based on EPA projections that 25% of all Public Water Systems (PWS) will exceed 15 ppb.
- The EPA does have a health-based goal, or Maximum Contaminant Level Goal (MCLG) for lead in drinking water- it is zero.
- Only 17 buildings sampled by us (out of 404) had no detectable lead in their water- 96% of all buildings and 87% of all samples collected had detectable lead.
- Water utilities achieve compliance when 90% of high-risk homes they sample release lead levels equal to or below 15 ppb.
- This means that even when regulatory standards are met, 10% of the homes can still be contaminated with lead levels exceeding 15 ppb.
- The researchers believe that if >10% of buildings sampled have water lead levels >5 ppb, the city has a serious lead in water problem.
- This is because our sampling does not target “worst case” homes. We are waiting for information about the location of lead water service lines from the city.
- Utilities, on the other hand, must collect 50% of their compliance samples from homes with lead pipe and the other 50% from homes with lead solder, as required by the LCR.
- In addition, utilities are required to collect samples for regulatory compliance during the hottest months (July-Sept), when water lead levels are generally highest. This study collected water samples throughout the year- including low risk months.
- Despite this, 23% of buildings sampled had water lead levels that exceeded 5 ppb.
- Fetuses and infants are more susceptible to lead exposures.
- Children can absorb 40-50% of an oral dose of water soluble lead, compared to adults, who can only absorb 3-10%.
- The greatest risk of lead in water may be to infants fed with formula that has been reconstituted with unfiltered tap water- the CDC estimates that tap water may account for more than 85% of total lead exposure among infants consuming reconstituted formula.
- Even very low doses of lead have been associated with irreversible adverse health effects.
- Some effects include: decrease in IQ and academic achievement; increase in attention-related and problem behaviors; reduced fetal growth and birth weight; increased incidence of spontaneous abortions and preterm birth; and decreased fertility.
- Perhaps most critically, our results reveal that prevailing exposure reduction guidelines recommended by water utilities and public health agencies, to flush water from the tap for 30 seconds to 2 minutes before using, may be inadvertently increasing lead exposures
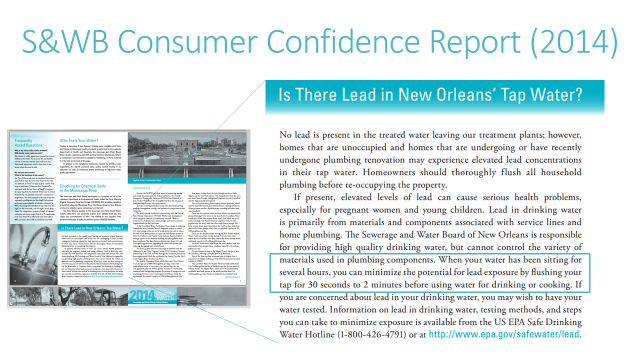
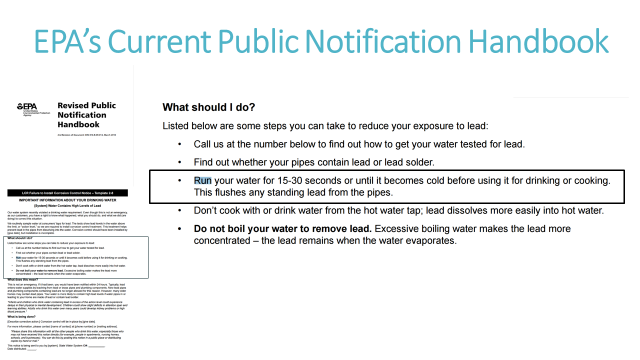
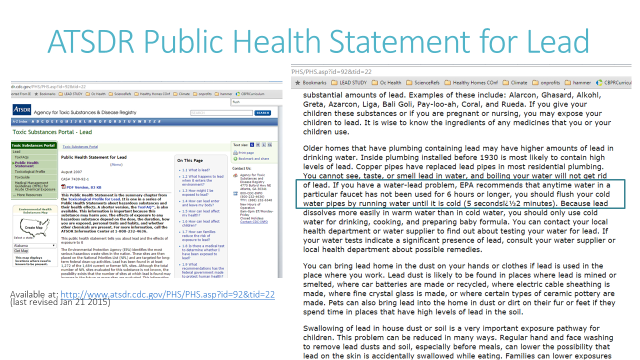
- Below are outreach materials from the New Orleans Sewerage and Water Board, EPA and Agency for Toxic Substances and Disease Registry (ATSDR), that were found online within the last three months directing people to flush their water for 30 seconds to 2 minutes to reduce lead exposure.
- Yet 61% of the buildings we sampled had increased water lead levels after either 30-45 seconds, 2 minutes or 3 minutes of flushing.
- 47% had increased water lead levels after 3-45 seconds of flushing.
- 41% had increased water lead levels after additional 2 minutes of flushing.
- 7% had increased water lead levels after additional 3 minutes of flushing (5-6 minutes total flush).
- While longer flush reduced exposure, it is still difficult to get rid of lead in some water systems by flushing. We are currently investigating what flush times would be most effective to reduce water lead levels. A good rule of thumb has been to flush the water for 5 minutes, then collect water in a bottle for use throughout the day.
- However, we have seen cases where water lead levels increased after even a five minute flush of the system.
- Thus, even if you water lead results come back low, you may still have a lead problem- it is hard to predict when lead particulates will detach and enter your water.
Last updated: 7/21/2017